
Time is so misunderstood
Along with bounce rate, Avg. Time on Page is one of the most misunderstood web metrics out there.
Understanding how time is actually calculated for visits to your website will not only give you a better understanding of how people are engaging with your site’s content, but it will help you avoid common misconceptions about that performance.
You should also understand how Avg. Time on Page and Avg. Session Duration are calculated, because one is usually far more accurate than the other, as we’ll see below.
Reality and analytics don’t align well
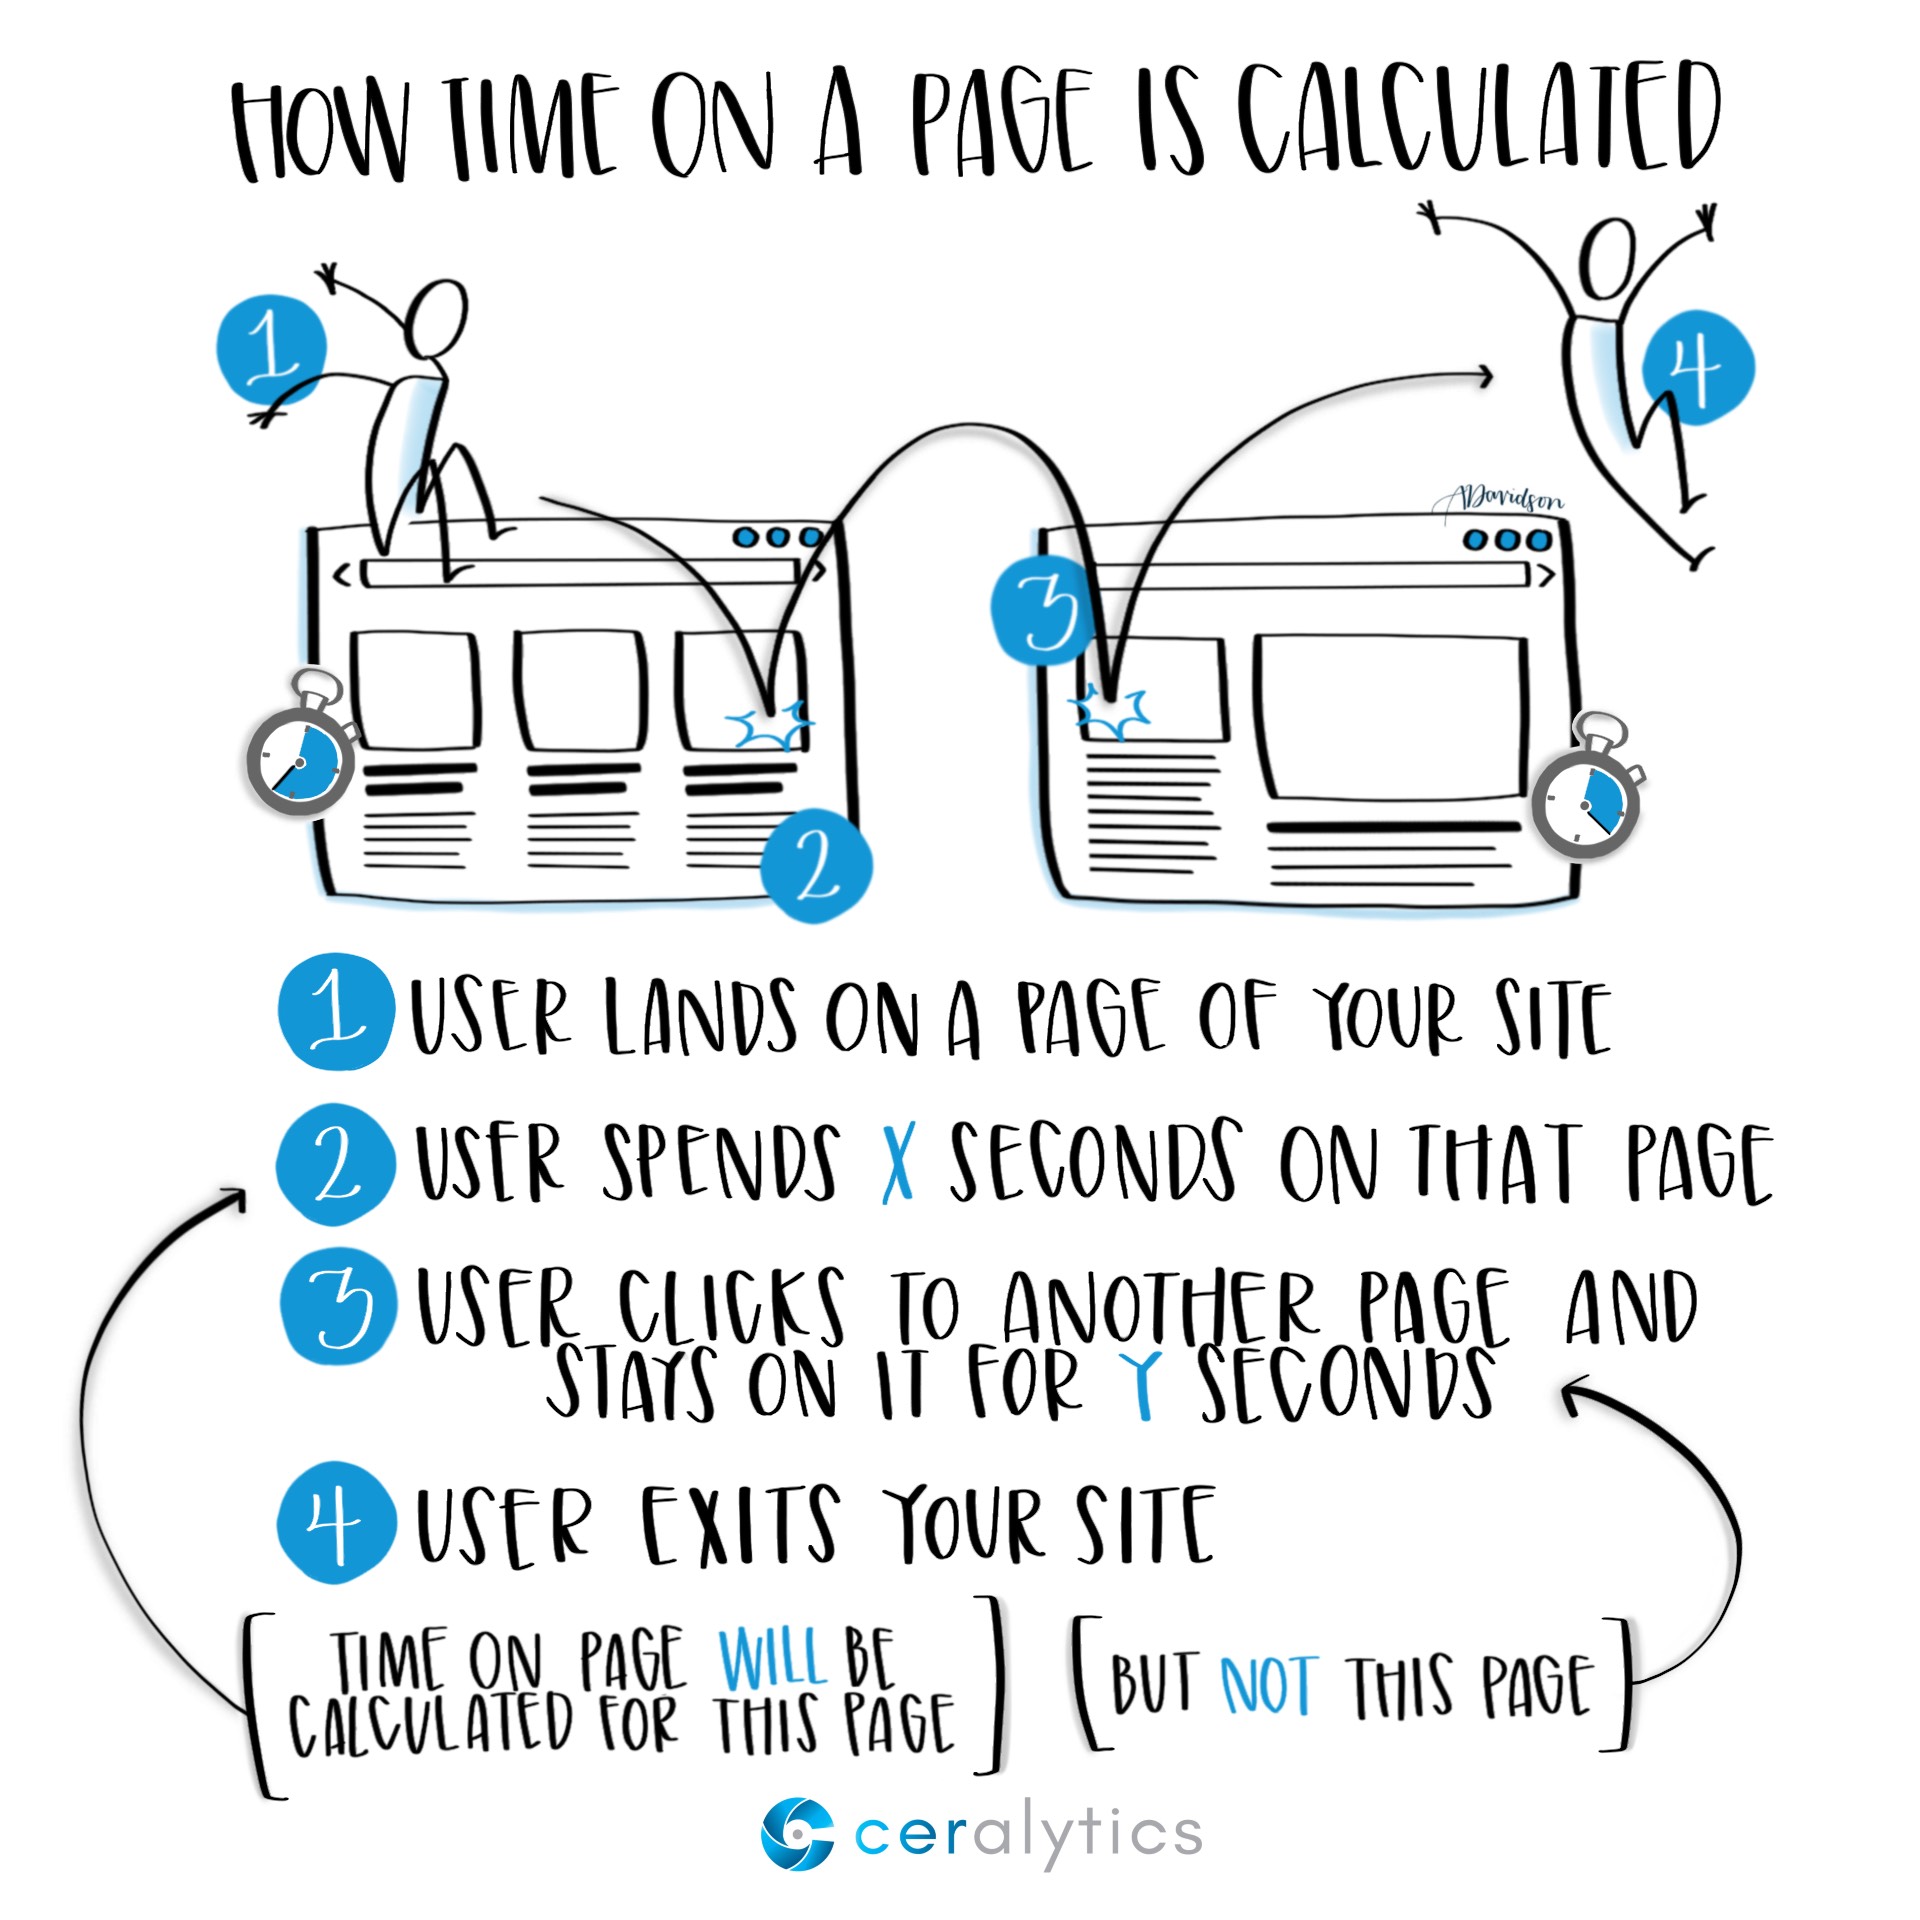
Let’s walk through the sketch above.
- A visitor lands on a page on your site. Google Analytics will make a note of the exact second that person landed on your page with a timestamp.
- The visitor will stay on that page X number of seconds.
- The visitor clicks to a new page on your site. Once that new page loads, Google Analytics makes note of the time and subtracts the old time from the new time to determine how long the user was on the previous page. The visitor then spends Y seconds on the second page.
- The person then exits the site – either closing their browser or opening up a new link outside of your site.
For the first page, we get a nice, clean metric. The person was on that page for X number of seconds, and that gets reported in Google Analytics.
However, since the visitor didn’t click another page on the site after viewing the second page, there is no next timestamp to compare against. So Google gives the time on that page a big ol’ goose egg.
0 seconds get attributed to that second page. Even if the visitor spent 30 minutes on that page, it still gets a big zero.
This same thing happens when a user hits one page of your site, stays for Z seconds and then exits. It counts as a bounce and the time on page is 0. Google Analytics doesn’t report the amount of time people spent looking at the last page of their visit to your site (an exit page.)
Therefore, Google Analytics always under-reports the amount of time people spend on your site.
Avg. Time on Page vs. Avg. Session Duration
Two metrics often confused are Avg. Time on Site and Avg. Session Duration. They represent different things, but since both are a measure of time, people often lump them together.
So what’s the difference?
Avg. Session Duration tracks the average time a visitor was on your site for a single session.
Avg. Time on Page calculates the average time people spend on a single page of your site.
On the surface it seems obvious what the difference is between these two – one is for the whole session and the other is just for one page.
But one of these metrics is unfortunately a pretty poor indicator of actual engagement on the site. Want to know which one?
Let’s walk through an example.
James lands on Page A, stays for 30 seconds, moves on to Page B for 20 seconds, and then moves to Page C for 40 seconds before he exits the site.
In reality, James just had an actual session duration of 90 seconds (30 + 20 + 40). However, because Google Analytics won’t report the time spent on the last page, Session Duration in Google Analytics will be 50 seconds (30 + 20 + 0) for his visit.
Joyce lands on Page B, stays for 60 seconds, moves to Page C for 50 seconds, and then moves to Page A for 90 seconds.
Session duration in reality: 200 seconds.
Session Duration in Google Analytics: 110 seconds.
Now Ulysses lands on Page C, stays for 100 seconds and then exits the site.
Session duration in reality: 100 seconds.
Session Duration in Google Analytics: 0 seconds.
The average session duration for these visitors in reality should be 130 seconds. Instead, Google Analytics reports that the Avg. Session Duration is 50 seconds.
That’s an error of 160%!
Makes you think twice about relying on Avg. Session Duration, doesn’t it?
Now let’s use the same information to determine Avg. Time on Page.
Google Analytics could easily just take the average of the time spent on each page above and report that out. If Google Analytics did that, the Avg. Time on Page would be:
Page A: (30 + 0) / 2 visits = Avg. Time on Page of 15 seconds.
Page B: (20 + 60) / 2 visits = Avg. Time on Page of 40 seconds.
Page C: (0 + 50 + 0) / 3 visits = Avg. Time on Page of 16.67 seconds.
As you can see, the averages for Page A and C are WAY OFF from reality because those two pages were both an exit page during someone’s visit.
To be more accurate, Google Analytics actually treats Avg. Time on Page differently than this. It removes any exit page visits from the calculation.
So the new calculations look like this:
Page A: (30) / 1 visit = Avg. Time on Page of 30 seconds.
Page B: (20 + 60) / 2 visits = Avg. Time on Page of 40 seconds.
Page C: (50) / 1 visit = Avg. Time on Page of 50 seconds.
As a result, Avg. Time on Page is actually a much better metric to use to establish the amount of time visitors spent on your site compared to Avg. Session Duration.
Next steps
When analyzing engagement on your website, understanding how long people spend on your site as a whole (Avg. Session Duration) and how long they spend on individual pages (Avg. Time on Page) are decent metrics, but they are not 100% accurate.
Use these metrics as rough guidelines for how well content is performing, but remember that pages with high exit rates will always under report how much time was spent on them.
So if you have a page that leads people intentionally to another site (such as to a white paper landing page, another application, a blog on a separate domain, etc.) it may have a high exit rate and show a very low Avg. Session Duration and Avg. Time on Site.
About Sketchalytics
Each week we send out a micro-lesson in marketing and/or business.
Our goal is NOT to give you best practices to go out and do what other people do. You can get that anywhere.
Instead, our goal is to give you knowledge that you can apply to your own organization to make the best decisions possible.
If you know anyone who you think would benefit from Sketchalytics, please feel free to share this with them so they can sign up.