Imagine the following scenario:
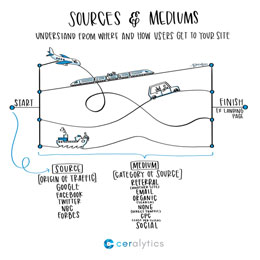
- A user comes to your site for the first time via a tweet. They don’t stay long, and end up leaving.
- The next day, they come back via a Google organic search. After staying on the site a little bit, they leave again.
- Finally, about two weeks later, they get an email from your marketing team. They click on the email link and convert to a sale or lead.
So…who gets credit?
The social media team will say, “Social gets credit! If they didn’t see that tweet, they never would have come to the website. That first touch is important!”
Not to be outdone, the SEO team will say, “Organic search should get the credit. The user obviously left after the tweet without doing anything, but organic search re-engaged them and set them up to convert.”
However, the email team will say, “Calm down everyone. The last thing they clicked was our email link and they converted. Obviously our superior emailing abilities caused them to convert. We deserve all of the credit.”
In the resulting brawl, someone gets stabbed in the pinky toe with a paperclip. It’s ugly.
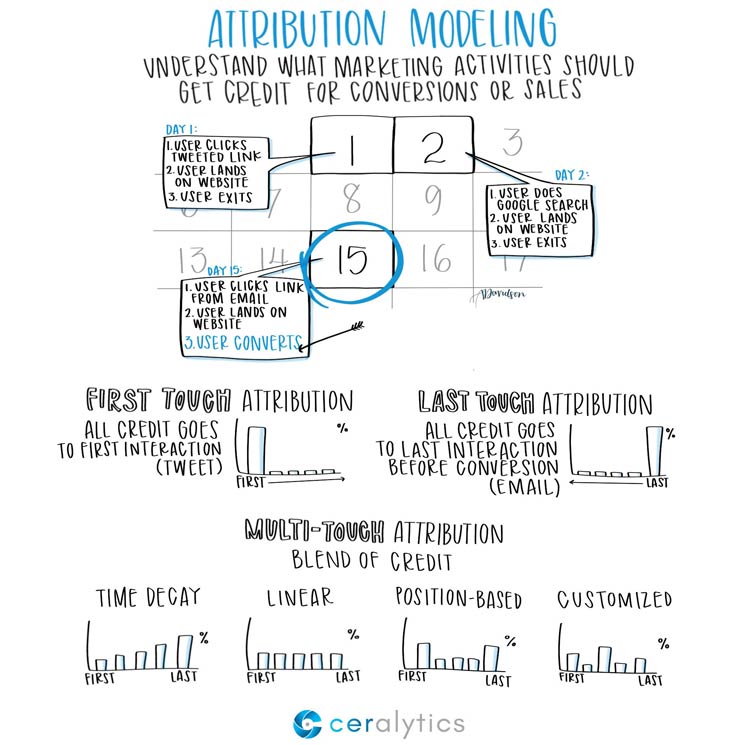
The answer to who gets credit is not cut and dry. That’s why we have attribution modeling.
The different attribution models
Attribution modeling looks at the interactions your audience took, and credits those actions in different ways depending on where they fell within the buyer’s journey.
There are many types of attribution models, and each have their own strengths and weaknesses. The basic attribution models are first and last touch attribution.
First touch attribution
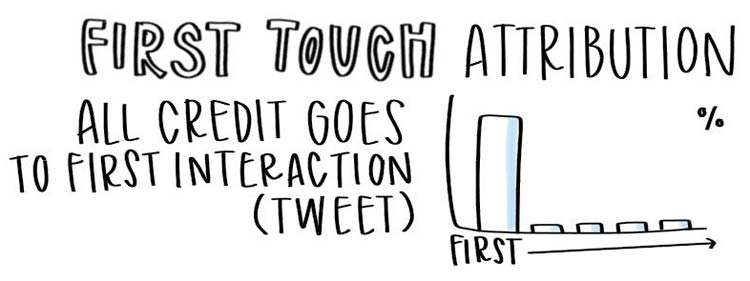
In the first touch attribution model, that first way someone got to your site gets 100% of the credit. PR and social pros love first touch attribution because it focuses credit at the top of the marketing funnel. After all, without getting people exposed to your brand and to your site, they will never buy anything. So first touch attribution should be important, right?
But if that initial touch point doesn’t convert to a sale or lead immediately, is it worth giving it all of the credit?
Last touch attribution
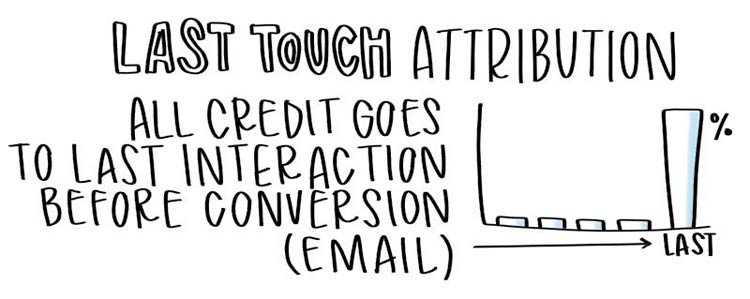 Last touch attribution gives all of the credit to the last activity the audience took before converting. This is a pretty standard approach for many marketers, as that last touch brought the audience over the finish line.
Demand generation teams love last touch attribution because those teams focus on the bottom of the marketing funnel. Their goal is to get a conversion immediately with their efforts. But without the first touch, or individual touches along the buyer’s journey, would the last touch have ever happened?
These two models unfortunately fall short of telling the whole story.
That’s where multi-touch attribution modeling comes in.
Multi-touch attribution modeling
Time decay attribution
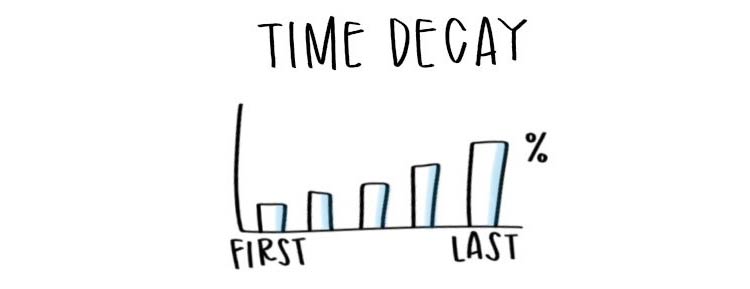 Time decay attribution gives the most credit to the activity that happened closest to the conversion, while the farther away an activity is from the conversion, the less credit it gets. Time decay attribution assumes that each touch point is driving the audience closer to the conversion and therefore should get more weight.
Though similar to last touch attribution, time decay attribution at least gives some credit to those initial touches.
Linear attribution
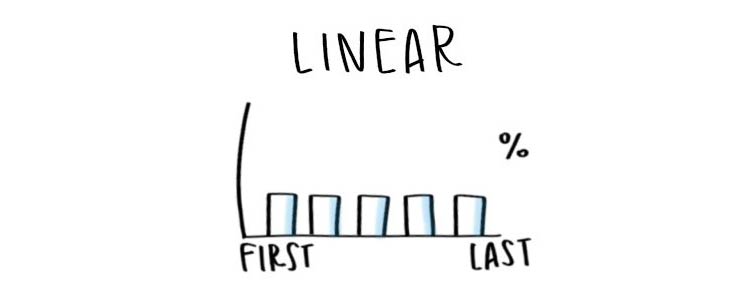 Linear attribution is the simplest multi-touch model. Every touch point gets the same amount of credit. The first touch gets the same as all of the middle touches and the last touch. Linear attribution seems to be the most fair model on the surface, but in reality, first and last touch activities can make a strong argument that they should be weighted higher than those activities that occurred in the middle of the funnel.
Position-based attribution
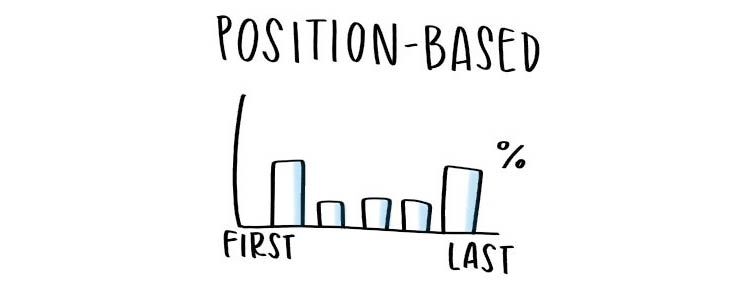 Position-based attribution gives more credit to the first and last touches. This is sometimes called U-shaped attribution.
The first and last touch each get 40% of the credit for the conversion while all other activities that happened between them split the remaining 20%.
At Ceralytics, this is the attribution modeling we utilize the most when reporting out leads. It takes into account the two most important aspects of the buyer’s journey – the activity that got the lead to our site, and the activity that converted them, while not entirely leaving out the rest of the touch points.
Customized attribution
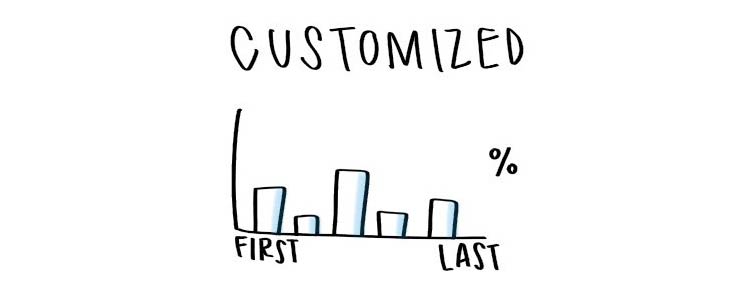 Sometimes you just need to figure out what works for you. A customized attribution model is one that your organization creates based on the feedback you get from your own data. Advanced organizations may use machine learning to develop their own customized attribution model.
Next steps to take
First, based off of the attribution models above, does one stand out to you as a good fit for your organization?
If you are in PR, first touch attribution is definitely something to look at to prove your success, but it can be utilized in conjunction with position-based attribution to show the link between building awareness and converting your audience.
If you are in content marketing, you definitely want to be looking at how your content not only brings people into the site, but what it then takes to get them to convert. That insight gives you more of what you need to build out a full content marketing strategy that takes the buyer’s journey into account.
The next big step is to get the data to show what’s working.
If you are in an organization with an analytics department, go ask if they have different attribution models already set up. If you don’t have an analytics department, or you are worried that talking to data geeks* means you might get trapped in a 45 minute conversation about Star Wars, you can still get to some great attribution modeling in Google Analytics.
Google Analytics has this functionality built into it. If you have goal conversions setup in your Google Analytics account, you can check out the different attribution models by going to Conversions > Attribution > Model Comparison Tool. The interface is very confusing and throws a lot at you at once. Here’s how to navigate it.
Select the goal/conversion you’d like to look at, set how many days back you want to look (it defaults to 30 days, but you can look up to 90 days back), and then select the model you’d like to view.
By default, Google Analytics will show you attribution by channel. To get a more granular look at what content drove the attribution, click on Secondary Dimension > Acquisition > Landing Page URL. Now you can see the channel and landing page that drove the conversions based on the attribution model you selected.
You can drill into each channel as well to see the sources and mediums that are credited with attribution. Just click on one and it’ll refresh with the source/medium combinations that make up that channel.
Now you have the power to see how your different channels, sources/mediums, and content are impacting your audience’s buying journey. Based on the findings, you may realize that certain channels need to be more present at the beginning, middle or end of the buyer’s journey.
If you’d like some help understanding how your content performs at various stages in the buyer’s journey, contact us. We’d love to touch base!
*We are data geeks; we feel comfortable saying this is a true fear of other people.
About Sketchalytics
Each week we send out a micro-lesson in marketing and/or business.
Our goal is NOT to give you best practices to go out and do what other people do. You can get that anywhere.
Instead, our goal is to give you knowledge that you can apply to your own organization to make the best decisions possible.
If you know anyone who you think would benefit from Sketchalytics, please feel free to share this with them so they can sign up.