
To be a truly data-driven organization, you need to use data to determine what worked, and what to do next.
That’s what the new Ceralytics Dashboard helps you do.
Accessing the Dashboard
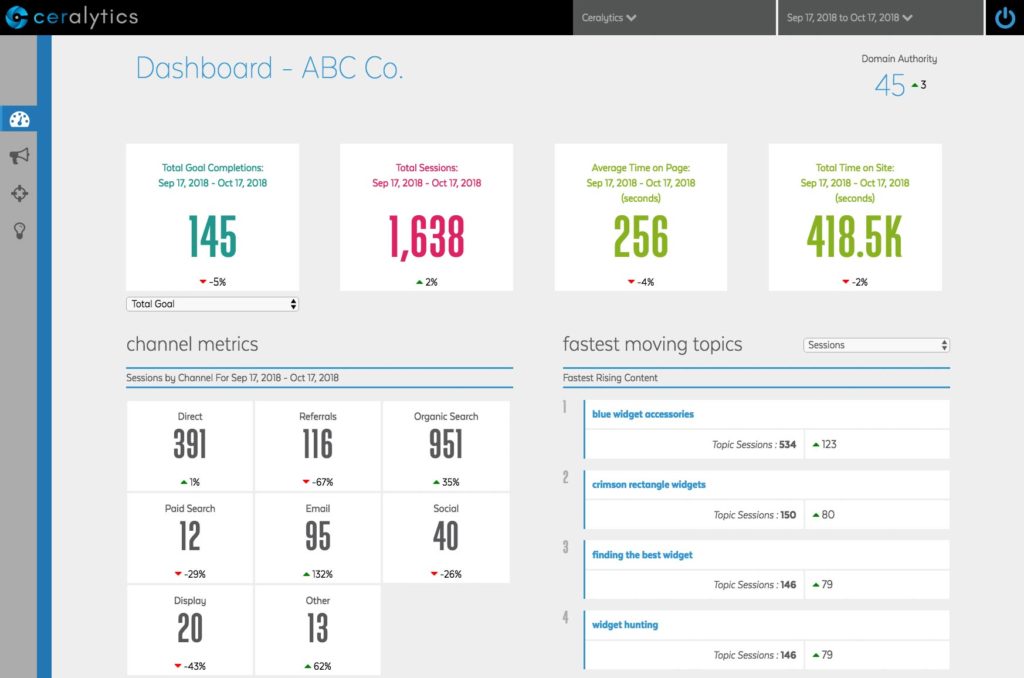
![]() When you log into Ceralytics, you’ll notice the new dashboard icon on the top left of the screen. Clicking it will take you to the dashboard. The dashboard is still in beta and may take a little bit of time depending on the size of the website. If you experience any issues with the dashboard, please email insights@ceralytics.com.
When you log into Ceralytics, you’ll notice the new dashboard icon on the top left of the screen. Clicking it will take you to the dashboard. The dashboard is still in beta and may take a little bit of time depending on the size of the website. If you experience any issues with the dashboard, please email insights@ceralytics.com.
Date Range
 Just like the Awareness and Conversion views, you can select your date range at the top of the page. This date range will automatically compare against the previous date range (for example, May 1 – 30th will compare against April 1 – 30th).
Domain Authority
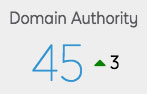 This was one of our most sought after updates. We include this in all of our Key Findings Reports, and now can offer it in the application itself. The Domain Authority is the trustworthiness of your site in the eyes of search engines. This section displays the Domain Authority for the given date range vs. the previous time period. In cases where a date range is more than one month, the application will take the average Domain Authority in a date range.
Total Goal Completions
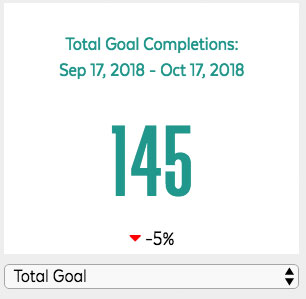 See the total goal completions your site has in the date range specified. By default this is set to total goal completions, but you can change this value to look at individual goals as well.
All goals that you have setup in Ceralytics will be displayed in this drop down. Any goals in Google Analytics that were not included in Ceralytics will be omitted.
Total Sessions
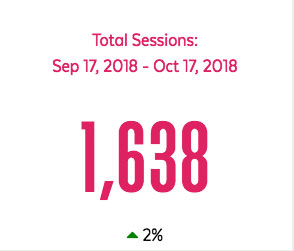 The total number of inbound sessions your site has brought in during the date range specified.
Average Time on Page
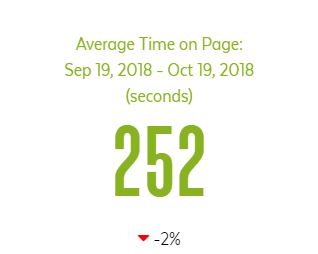 Google Analytics is notorious about providing inaccurate information in regards to how much time users actually spend on your site using Session Duration. We’ve updated this methodology to show a more accurate view of how much time your average user spends on the most important page of your site: the first page they land on.
Total Time on Site
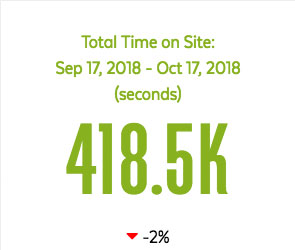 Again, using our methodology for calculating the Average Time on Site, we can provide a more accurate measure of the total time your visitors spend on your site.
Channel Metrics
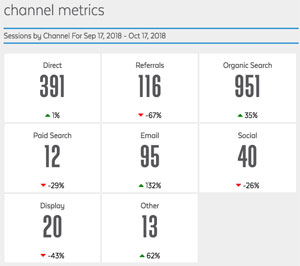 This is an overview of how people are currently getting to your website, just like the individual Topic View shows.
Sessions by Device
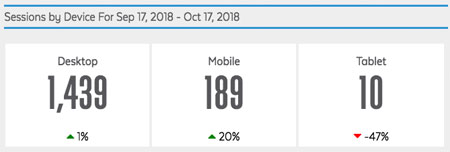 Like the individual Topic View, this shows you an overview of what types of devices people used to come to your site.
Sessions by User Type
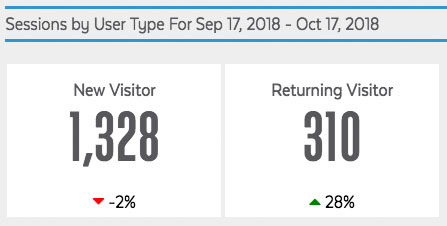 A breakdown of New vs. Returning visitors.
New Competitor Articles
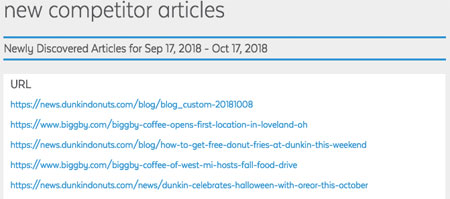 All of the new articles your competitors have created in the defined date range. These articles start at the first day data was loaded into your account. So if you look at a date range that ends before the start of your Ceralytics subscription, you will not see any new articles.
Fastest Moving Topics
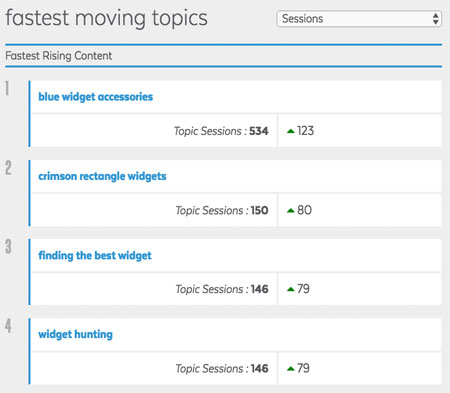 This is one of our favorite new features!
At a glance, see which topics are moving up or falling fastest. You can then explore why a topic has moved up or down by clicking on it to open the Topic View. Within the individual Topic View, you can turn on “% change” to see if the change happened for a specific channel, page, or visitor type.
For example, a topic may suddenly jump because it began ranking higher in search, or a social campaign excelled with the topic. On the flip side, a topic can drop because it ranks lower in search.
The Fastest Moving Topics section is a great way to catch issues happening on your site right now, and either correct them (if some topics are falling dramatically) or add fuel to the fire if a topic is moving up quickly.
Fastest Moving Topics can be filtered to show topics that are moving the fastest in sessions or individual conversions.
Domain Authority Update
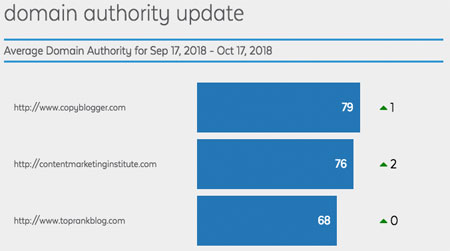 Benchmark your site vs. your competition via Domain Authority. Increases in Domain Authority are usually the result of new articles being published, or better inbound links. If your competition is pulling away from you, it’s time to start investing in better content and building inbound links to get your Domain Authority up as well.
We want your feedback
The new Ceralytics Dashboard is currently in beta, so we would love your input. Email insights@ceralytics.com to give us your feedback.